VoyceMe · Shipped 2025
Letting the data turn a homepage refresh into a series discoverability redesign
- Team
- Product designer (me), product manager, marketing, developers
- Deliverables
- Data analysis, a phased roadmap, mobile & web designs
- Impact
- +60% pages per session for high-intent readers
- +71% Genres visits on mobile
- +114% series click-through from search
- +172% session time on Discover
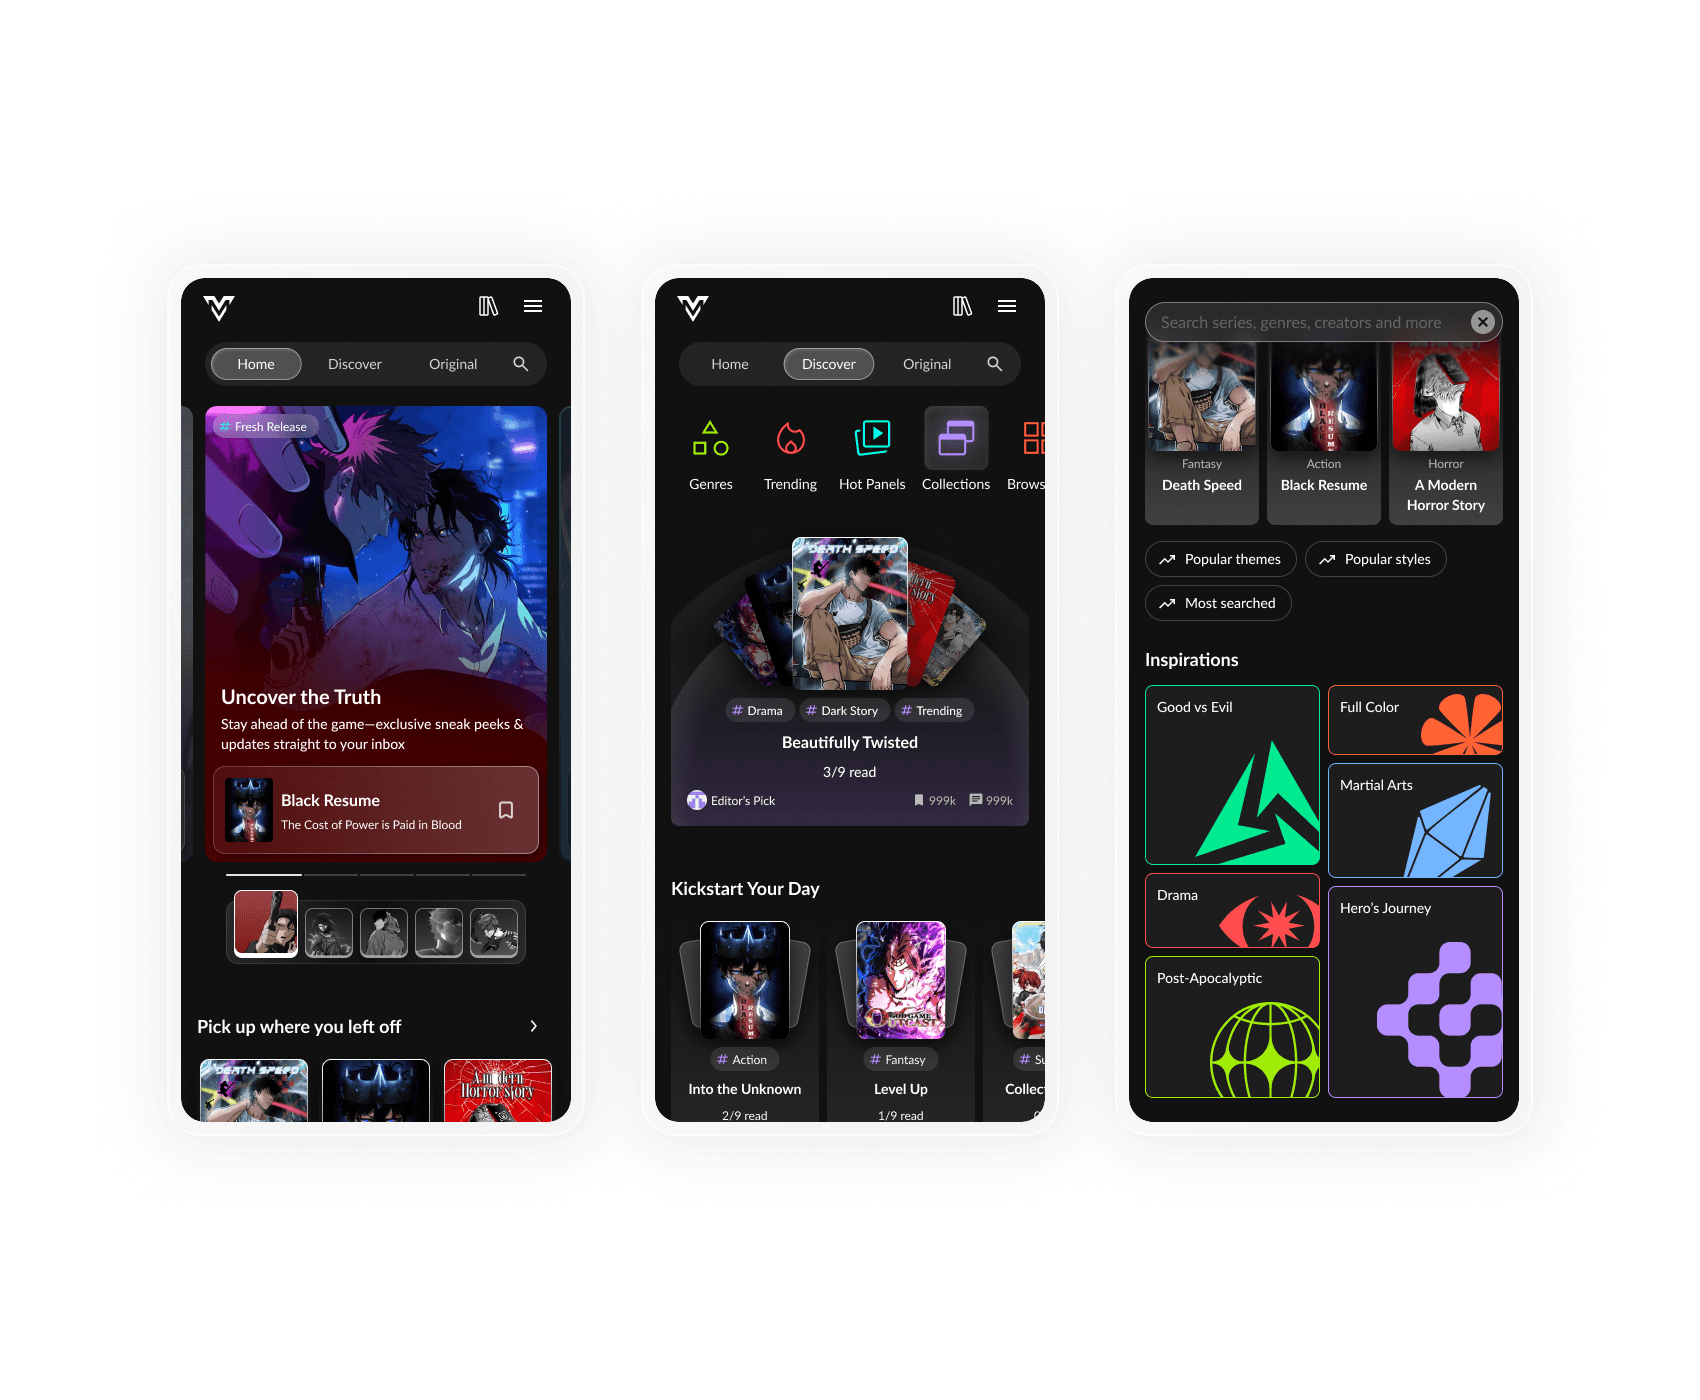
The designs: home, search, and Discover on mobile
Home
Search
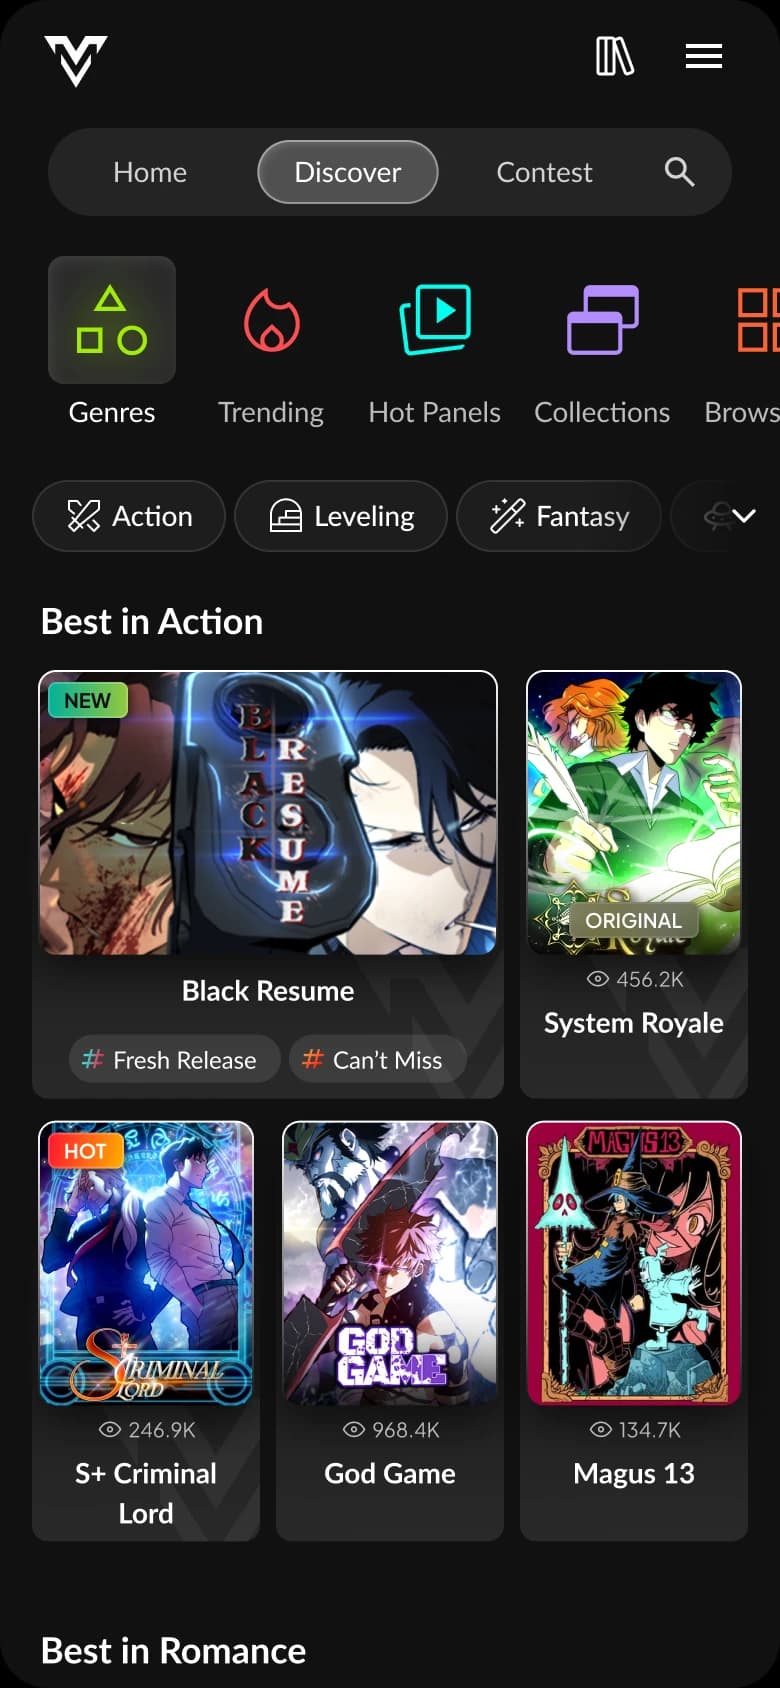
Discover · Genres
Discover · Hot Panels
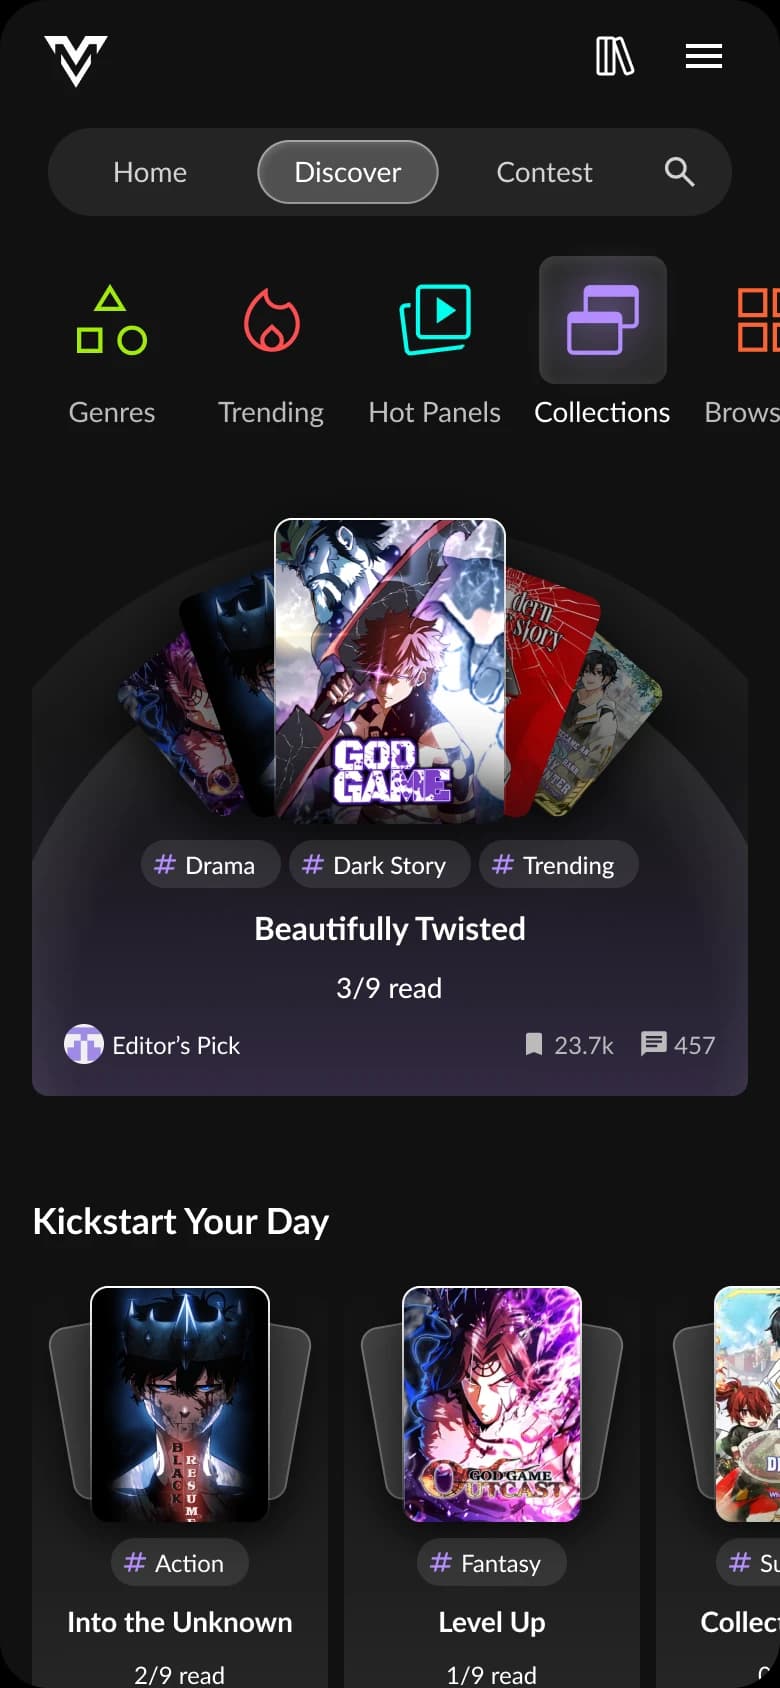
Discover · Collections
01 / The discovery gap
Over half of readers never started a second series.
VoyceMe relied on ads and campaigns for traffic, and they were costly. Most of those visitors left without engaging and had the lowest conversion to app users.
The readers VoyceMe needed were already on the site. About 90% of readers who browsed or searched had significantly higher retention. Helping these high-intent readers find more to read was a shorter path to regular readers than buying traffic.
They still dropped off twice: before starting a first series, and before finding the next one.
02 / What the data showed
Genres was hidden on mobile, and search rarely led to a series.
Over 90% of readers were on mobile, yet 60% of Genres visitors came from desktop. On mobile, Genres (browsing by category) and Originals (VoyceMe’s own series) were hidden in the menu.
Fewer than 5% of searches led to a series. Many were for themes or for titles VoyceMe doesn’t carry, and ended on an empty page instead of a recommendation.
Editor’s Pick, a homepage row of hand-picked series, drew the most clicks below the banner. That made curation the third direction.
03 / The solution
Close both gaps inside the product, quick win first.
The strategy was product-led growth. Instead of buying more visitors, get the readers already here into a first series, then the next.
Navigation and search close the first gap; Discover closes the second. Each phase answers one finding from the data.
The PM and I ranked the work by impact, success metric, effort, and capacity, and traded one big launch for 3 phases we could measure one at a time. Navigation, the smallest build, went first.
03 / Three phases
Answer every search with something to read.
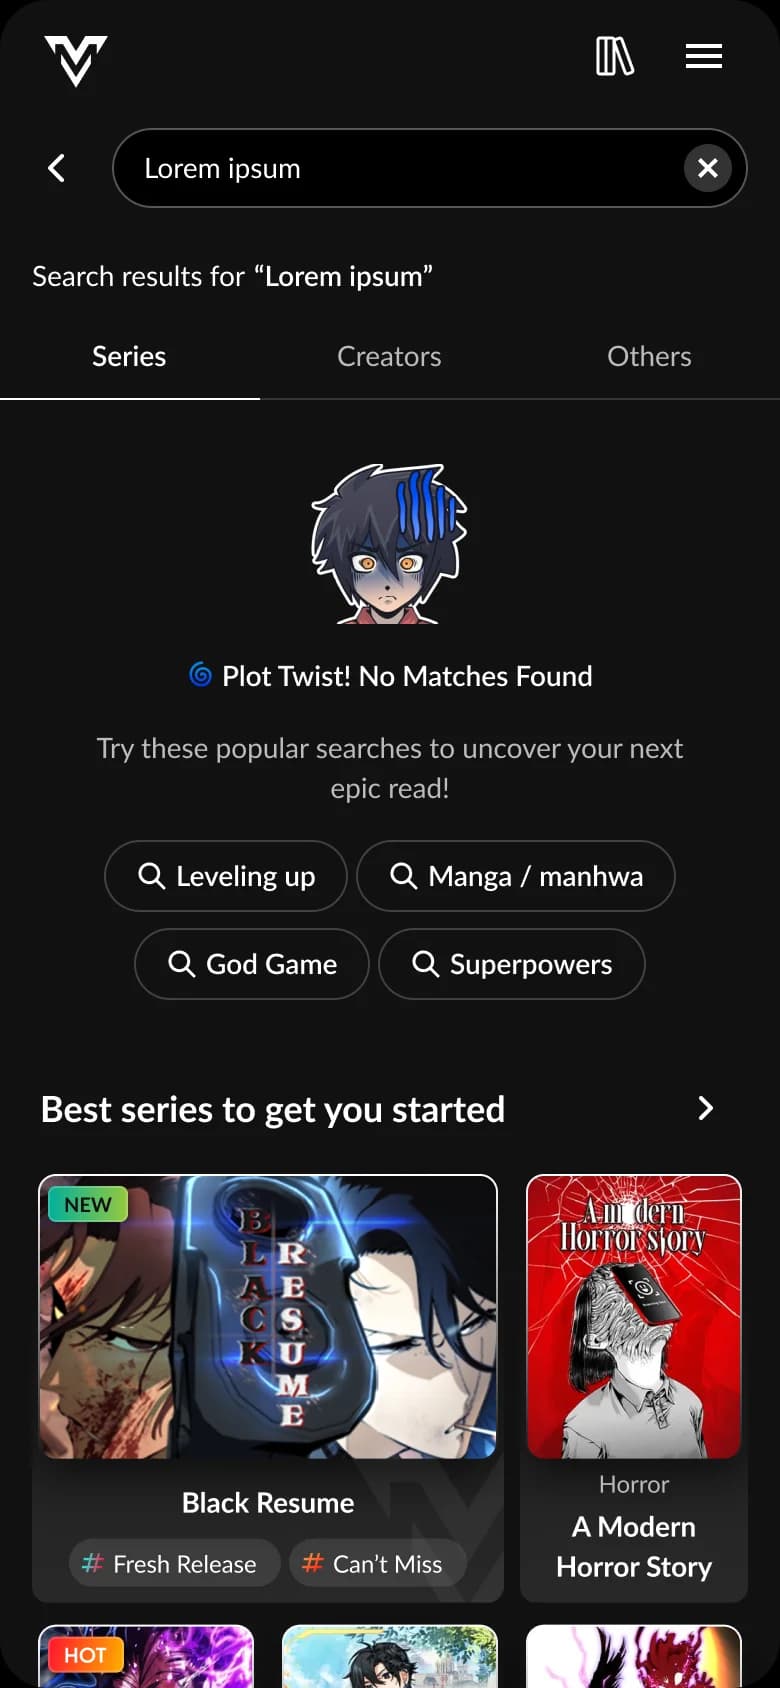
Search came second. Readers who search are high-intent, yet fewer than 5% of searches led to a series. Search now opens with popular themes and art styles, and suggests series as readers type.
A search with no match used to end at an empty page. Now an unknown term suggests other searches and series, and a title VoyceMe recognizes but doesn’t carry suggests similar series.
Give readers reasons to browse, not just search.
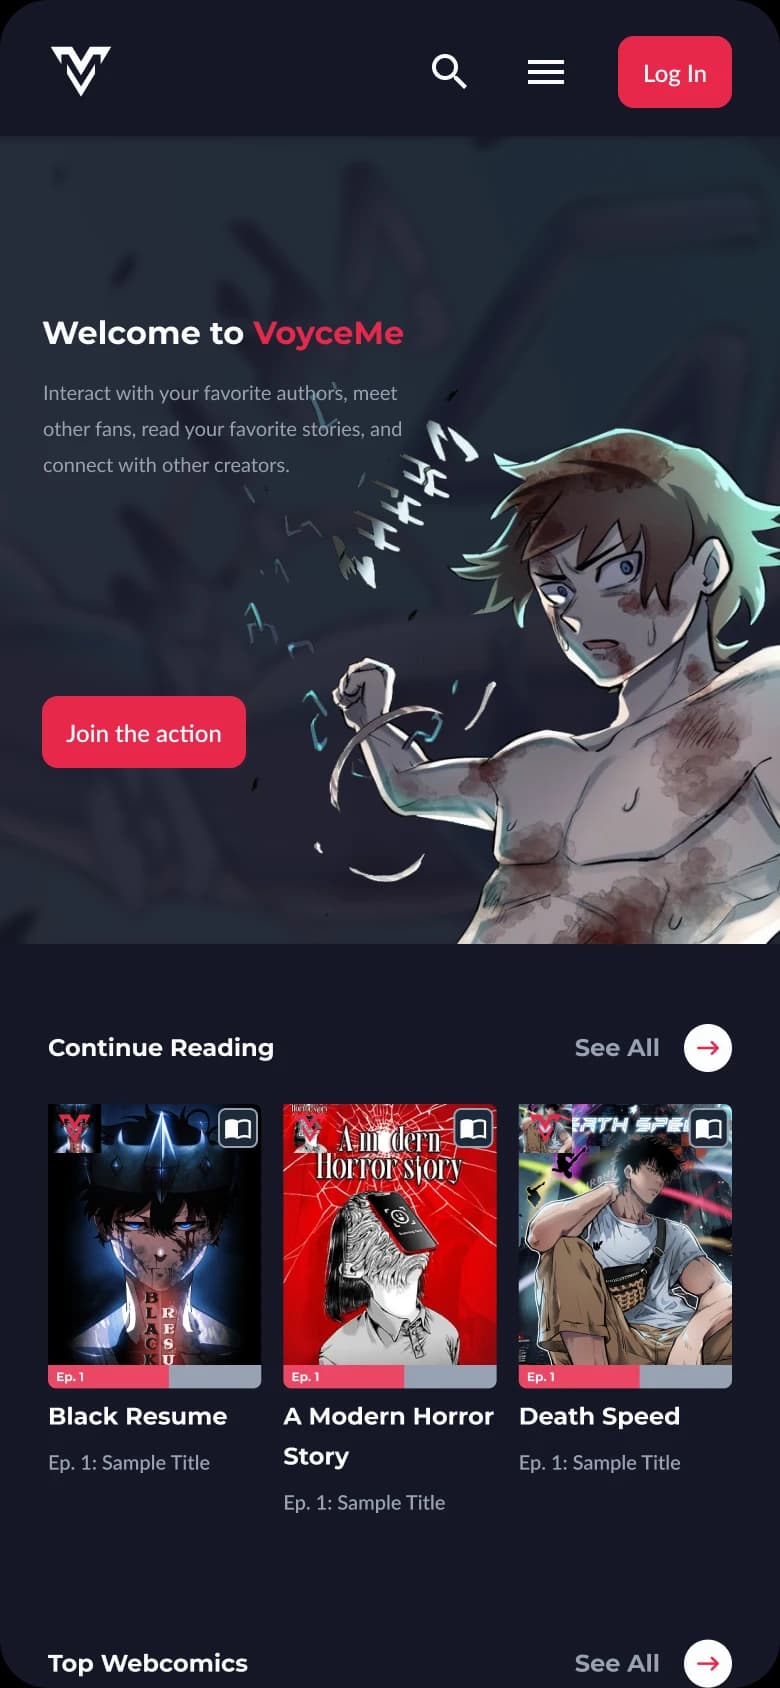
The data suggested a brand problem: Originals wasn’t yet attractive or trusted enough to be a main navigation page. So we promoted it in the refreshed homepage’s hero banners instead.
Readers also needed more ways to find series. A new Discover page replaced Originals and Genres, and its 5 ways in (Genres, Trending, Hot Panels, Collections, Browse All) let us test new kinds of recommendations.
/ The prototype
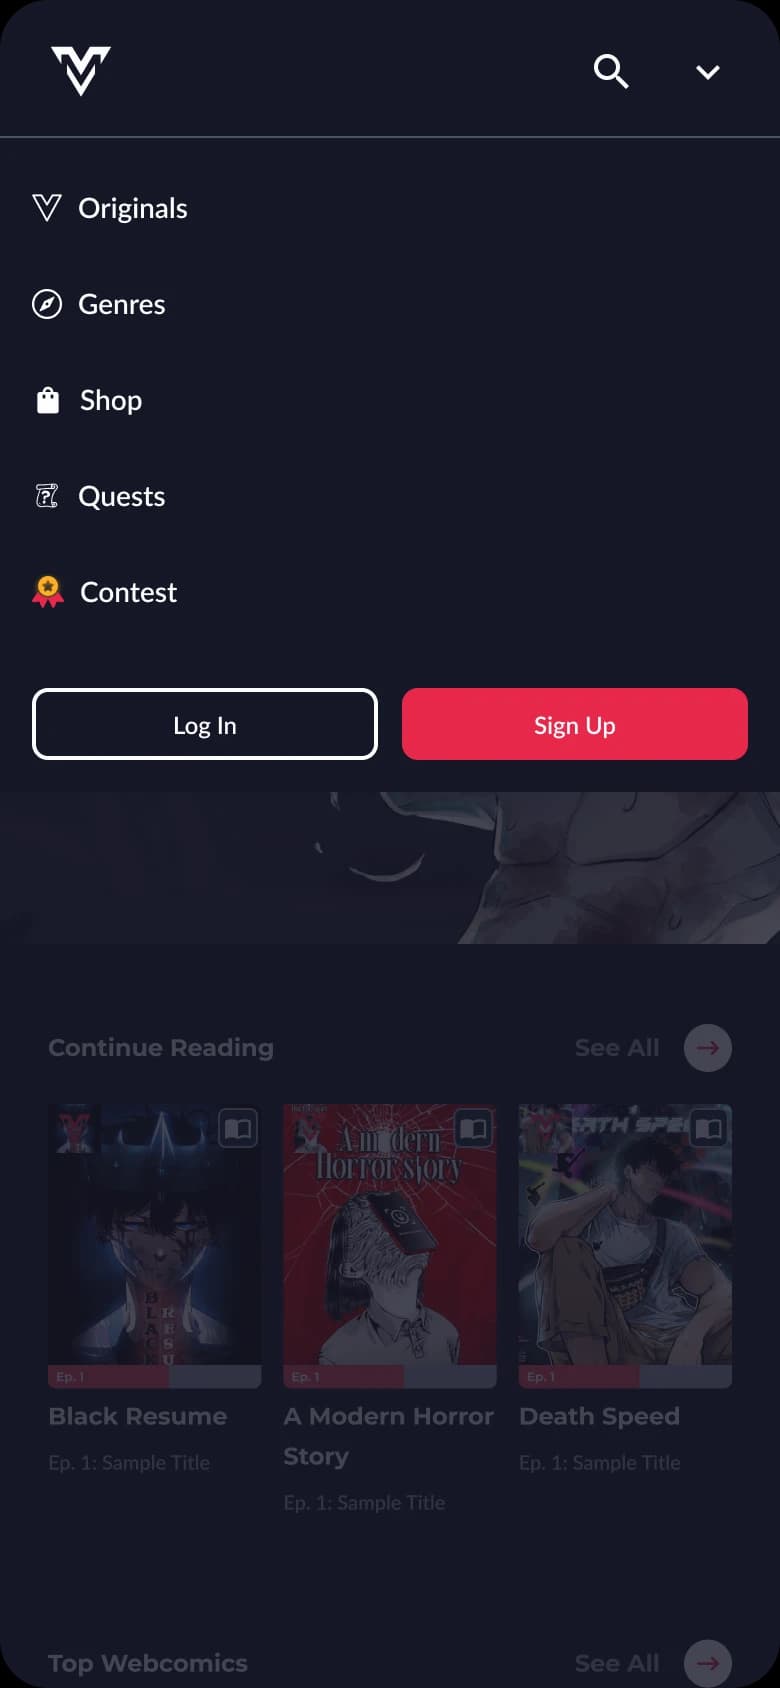
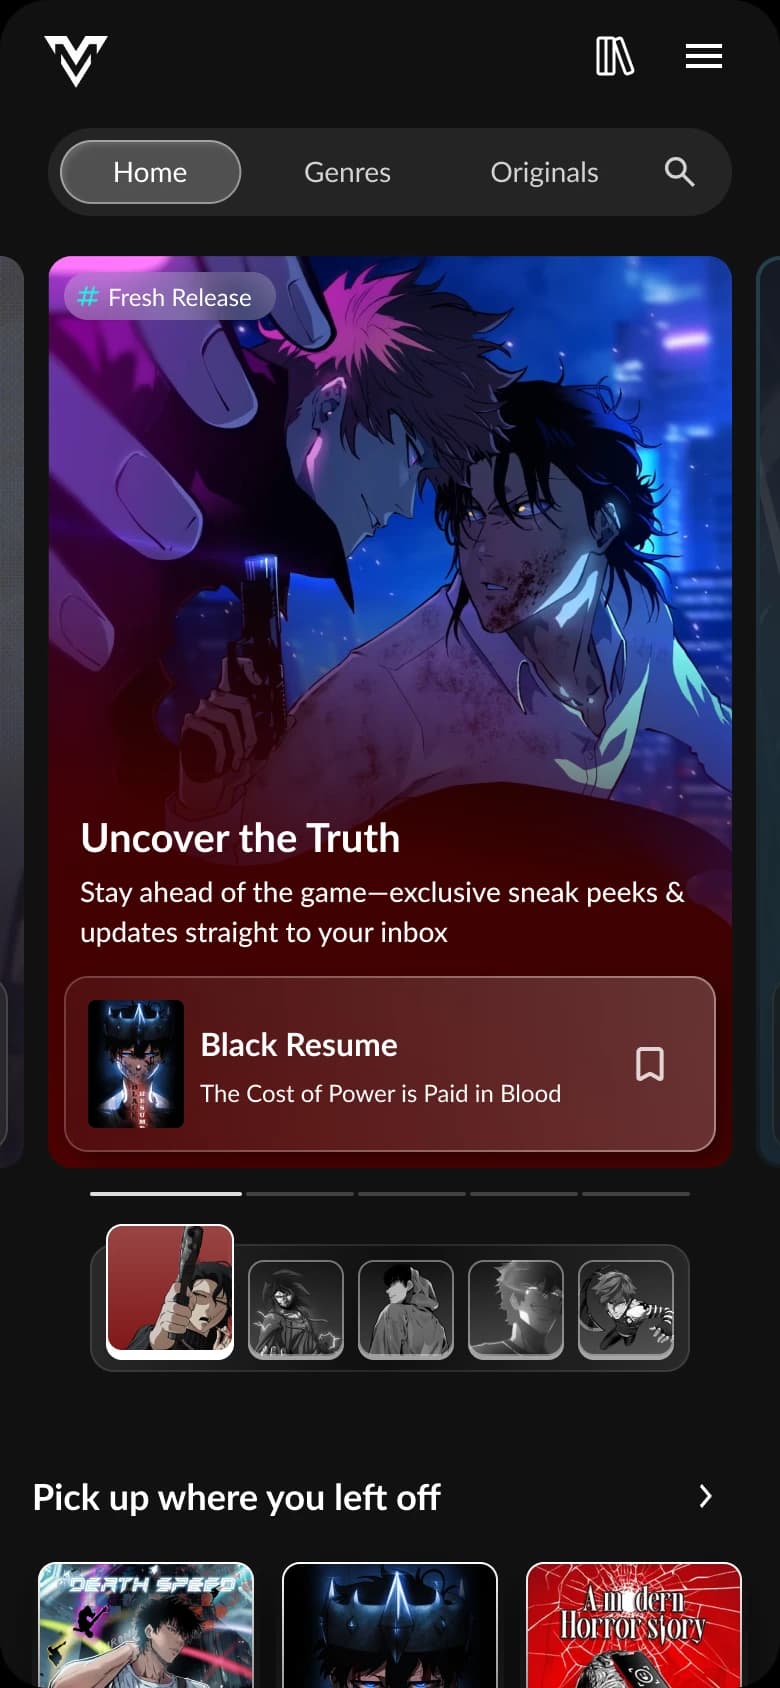
Success metricMore Genres visits on mobile
Searching
No match
Known title
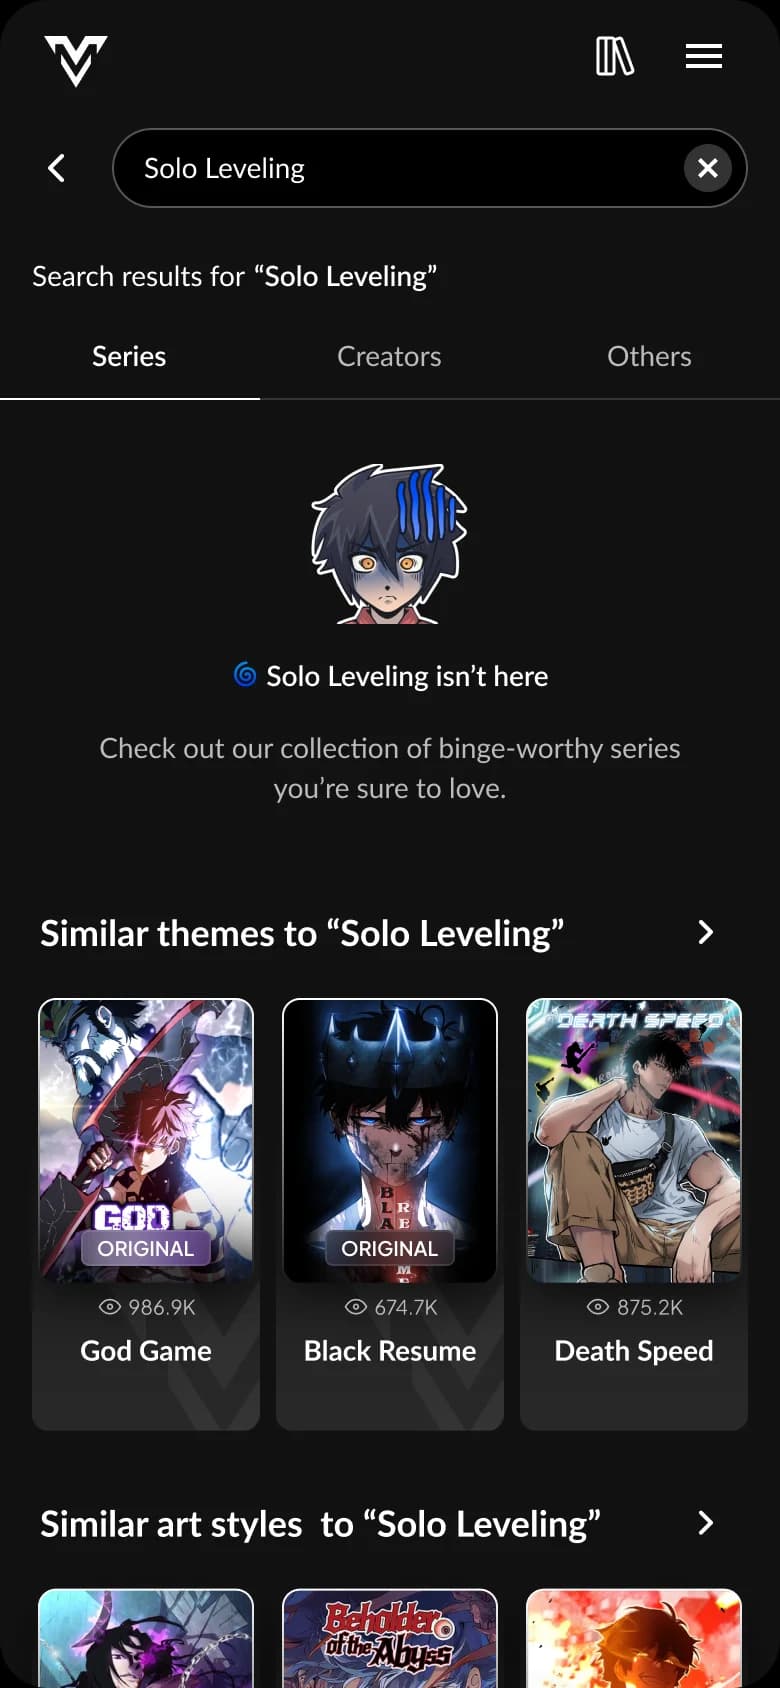
Success metricHigher series click-through from search
Home
Discover · Genres
Discover · Trending
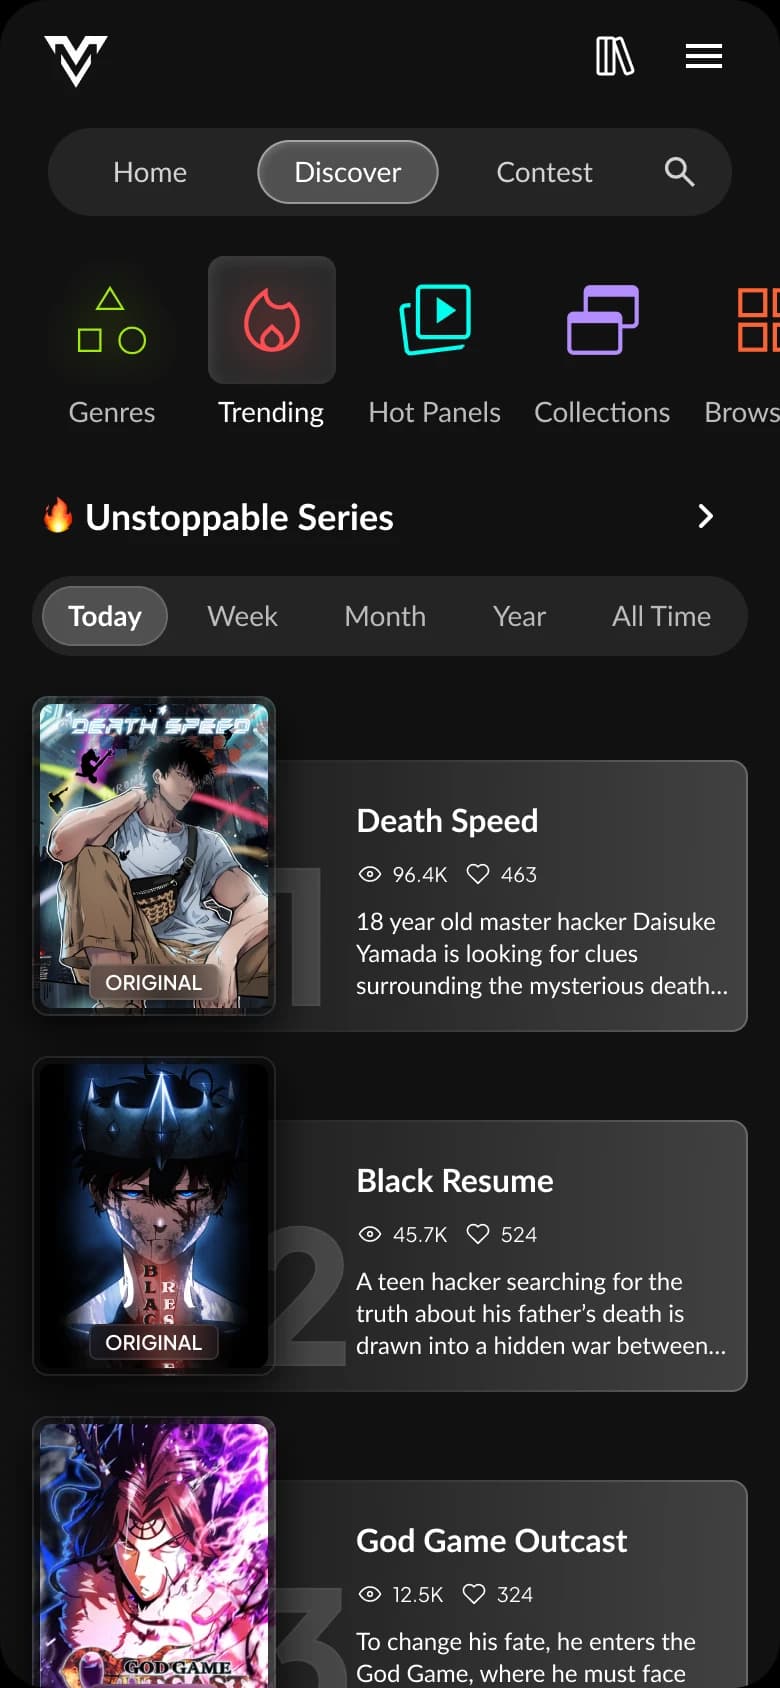
Success metricMore Discover visits, series click-through, and time spent
04 / The impact
High-intent readers visited 60% more pages per session.
Usage data from Q1–Q2 2025 shows each phase moved the metric it was built for. Genres visits on mobile rose 71% after Phase 1, and series click-through from search rose 114% after Phase 2.
Sessions on Discover ran 172% longer than on the Originals and Genres pages it replaced. Readers had reasons to browse, not just search. Because each phase had its own metric, each result could shape the next phase.
05 / The takeaways
Solve the problem behind the request.
Let the data define the problem. A homepage update would have changed one page. Following readers through the whole journey showed where discovery broke down.
Start with the quick win. The navigation change was small, fast to ship, and easy to measure. It gave the team evidence before we put sprints into the bigger phases.
Plan with the people who build it. Splitting the plan into sprints with the developers kept each phase’s scope realistic, and each phase shipped with a goal we could measure.